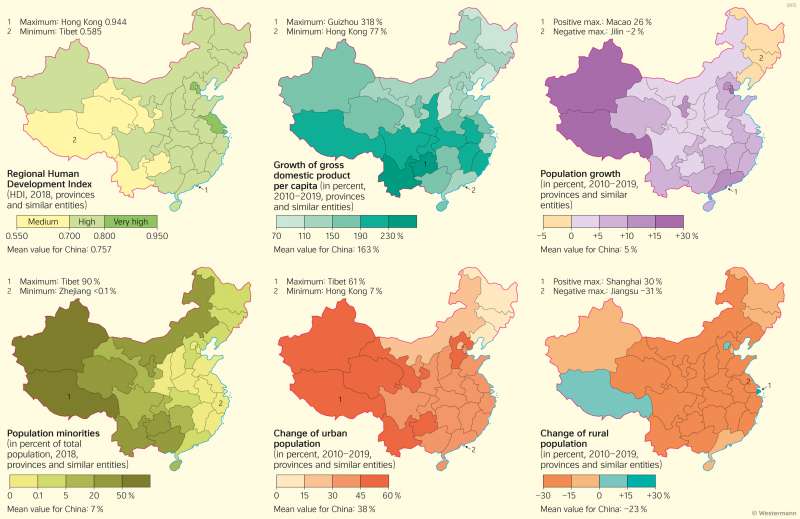
China - Regional disparities
Economic development and urbanisation
978-3-14-100890-6 | Page 126 | Ill. 1

Overview
The map composition "Regional disparities" for the administrative units of the People's Republic of China (municipalities, provinces, autonomous region and special administrative regions) sis one of 5 such map displays in the atlas - the other being the British Isles (UK & Ireland, see 83.4), Russia and its neighbours (see 114.2), India (see 123.6) and Brazil (see 196.1). The purpose of these map compositions is to establish a sub-national country profile based on a set of similar statistical indicators (such as population development within the last 10 years, gross domestic product, both per capita - for this confer map 125.3 - as well as over time). It is thus possible to compare the subsequent regional patterns of a common statistical indicator among the aforementioned set of countries.
Economic and demographic disparities
The left map in the upper row shows the subnational Human Development Index (HDI) and is therefore comparable with map 114.2 (Russia and neighbouring countries). Most of the Chinese subdivisions have a high development index with the exception of municipalities (Beijing, Tianjin, Shanghai, Hong Kong and Macao) and the province of Jiangsu (including the western and northern Shanghai suburbs), which have a very high development index, as well as the peripheral provinces of Tibet, Qinghai, Gansu, Yunnan and Guizhou, which have a medium development index.
This pattern is also reflected by the distribution of the gross domestic product (GDP) per capita 2019 (see map 125.3) and in its growth rate for the period 2010-2019 (middle map in the upper row). However, these maps also show that the northeastern Manchurian provinces lag behind southern and central provinces. This observation is also confirmed by population growth for the same period. Here, the Manchurian provinces show a negative development while subdivions along the Yellow Sea coast as well as in the south show strong population growth which is superseded only by the western peripheral provinces of Tibet and Xinjiang as well as Tianjin as municipality.
The maps in the lower row show very specific topics. The left map features ethnic minorities - the lighter the colour, the more dominant Han-Chinese population, the darker the colour, the less dominant Han-Chinese and the more dominat are different ethnic minorities such as Tibetans or Turkic Uyghurs in Xinjiang.
The last two maps show the change of both urban and rural population between 2010 and 2019. What is almost stunning is the decline of rural population between 15% and 30% (!) in most subdivisions except a few in the peripheries: Tibet, Beijing and Shanghai with positive figures and Xianjiang, Guandong and two northern Manchurian provinces with slightly negative figures. In contrast, urban population grew everywhere between 2010 and 2019, less so in Manchuria but very strongly around Beijing/Tianjin and in all western and southwestern subdivisions. When considering the fact that natural population change is still insignificant due to the ongoing consequences of the "one-child-per-family" doctrine, this clearly shows that internal migration from rural areas into big cities and agglomerations is still taking place on a large scale.


