India - Regional disparities
Monsoon and regional disparities
978-3-14-100890-6 | Page 123 | Ill. 6

Overview
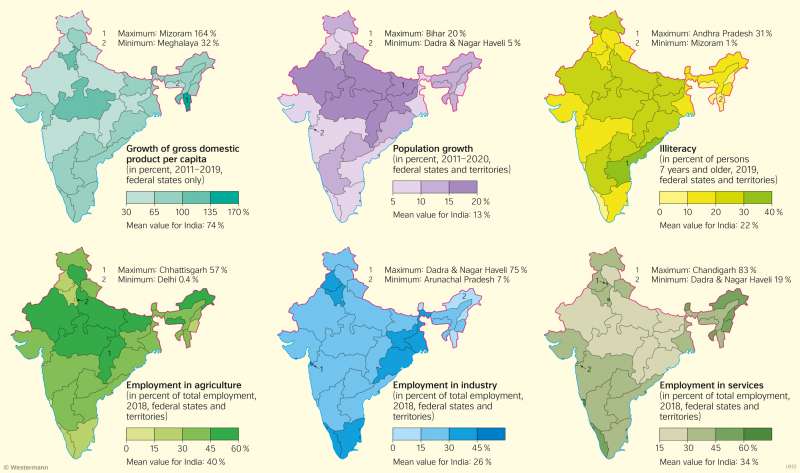
The map composition "Regional disparities" for the federal states and union territories of India is one of 5 such map displays in the atlas - the other being the British Isles (UK & Ireland, see 83.4), Russia and its neighbours (see 114.2), China (see 126.1) and Brazil (see 196.1). The purpose of these map compositions is to establish a sub-national country profile based on a set of similar statistical indicators (such as population development within the last 10 years, gross domestic product, both per capita - for this confer map 125.2 - as well as over time). It is thus possible to compare the subsequent regional patterns of a common statistical indicator among the aforementioned set of countries.
Economic and demographic disparities
The statistical maps illustrating regional disparities in India, based on federal states and union territories, show almost the same indicators as those on page 83 for the United Kingdom and the Republic of Ireland. Only here we can see a map about illiteracy whereas the gross domestic product per capita is shown on map 125.2, which thus needs to be looked at too when establishing regional disparities among Indian states and territories.
With regard to the growth of GDP per capita during the period 2011-2019 the northern and central states show a less than average growth, whereas the southern and eastern states have an average or slightly above average growth. Only the states of Madhya Pradesh, Haryana, Tripura, Mizoram as well as Sikkim feature clearly above average GDP per capita growth rates, of which only Haryana and Sikkim feature a GDP per capita in 2019 which is at least one and a half times as large as that of the Indian average.
The maps about population growth (2011-2020) and illiteracy feature a very similar regional pattern. Almost the same northern and central states and territories show high population growth rates (with the exception of Andrah Pradesh) and high rates of illiteracy at the same time. On the other hand, those states and territories which have low population growth also have low rates of illiteracy. This seems to suggest that both population growth and illiteracy are interconnected in some ways.
The 3 maps featuring employment according to sectors are in stark contrast to those for the United Kingdom and the Republic of Ireland on page 83. In India, employment in agriculture and mining is still of overwhelming importance as opposed to employment in industry and construction or in services. Especially in northern states and territories more than half of the workforce are harvesting plant-based, animal-based or mineral resources whereas in southern and eastern states industry/construction and/or services prevail. Of all Indian states and territories only Chandigarh, the planned joint capital of Punjab and Haryana, has a mix of employment comparable to most regions of the UK: 1% primary, 16% secondary and 83% tertiary employment.


