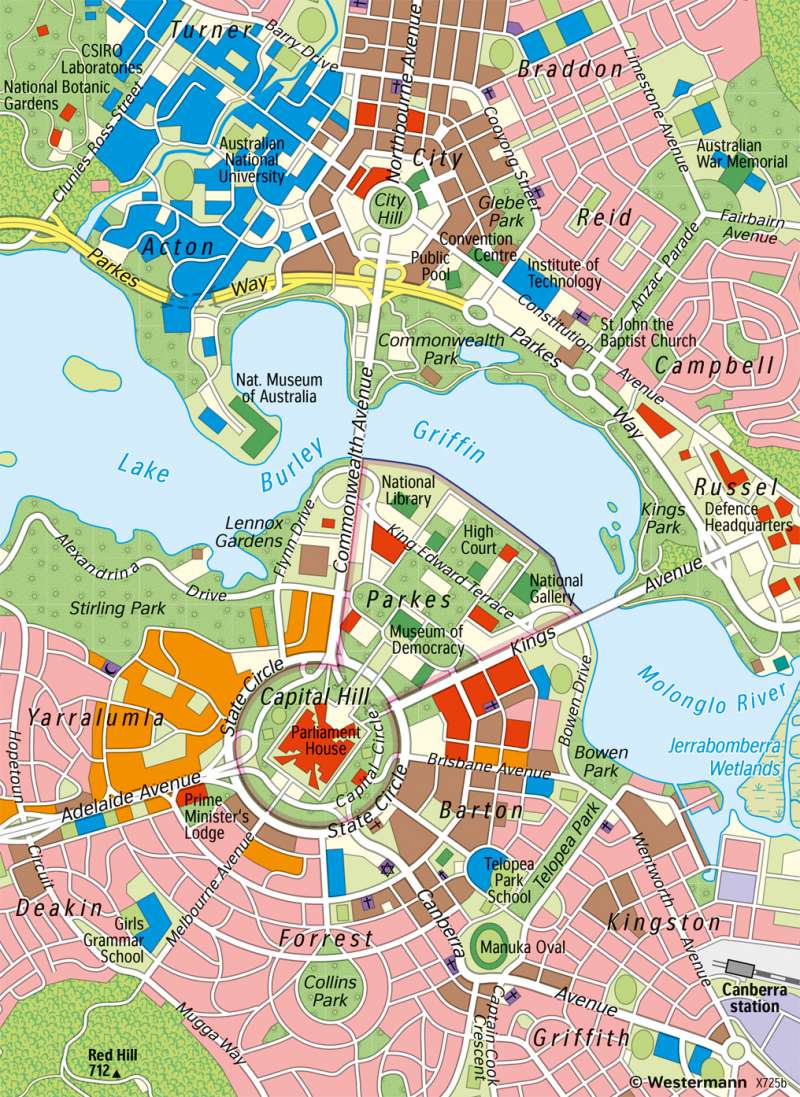
Canberra (Australia) - Thematic maps of a planned capital
Thematic and physical maps
978-3-14-100890-6 | Page 6 | Ill. 2

Some state capitals, in contrast to a variety of cities, have little historical past. They only emerged on the drawing board in the course of the 19th or 20th century. This phenomenon is particularly common in states that formerly held the status of a colony. One such example is the Australian capital Canberra.
Functional structure in 1940 and 2020
As many planned cities, Canberra’s functional structure in 1940 showed clear divisions. About 40% of the area shown in the map was built up. The residential parts for the 16,000 inhabitants were located southeast of Capital Hill and northeast of City Hill. At their edge, central business districts developed. The other districts were sparsely built up. Around Capital Hill, some public and political institutions were located. In the north and northwest, there were some educational institutions. Among them are the laboratories of the Commonwealth Scientific and Industrial Research Organisation (CSIRO) which is Australia’s national science agency.
The patterns persist in the functional structure in 2020. The general street outline has been maintained and extended, especially in the residential areas and in Acton. A second avenue now connects Capital Hill and Russell, completing the triangular pattern that the city planners had drawn up. The business districts and the residential areas are still at their original location, but have hugely expanded their area, offering supply and living space for the roughly 430,000 inhabitants (2020). The number of political institutions on Capital Hill has increased too, e.g. with the opening of Parliament House in 1988. The district where the CSIRO laboratories were established has become an important scientific and educational centre, e.g. with the foundation of the Australian National University in 1946.
Training map reading skills
The maps can be effectively used to train map reading skills. In a first step, they can be connected with the boxes 1 and 3 on the same page. Finding and locating the different types and variations of map symbols can help understanding the way thematic maps process information. In a second step, the comparison of maps can be trained. To do this, a simple method with cut-out paper is described below the map. This method can help focus on different functional parts of the city. It can help making more precise comparisons, e.g. of the percent of built-up area north of Canberra in 1940 and 2020. Likewise, changes in the centre of Canberra can be analysed better when limiting the scope of the map. This could help e.g. when comparing the number of government buildings on Capital Hill in 1940 and 2020.
Foundation of a planned city
The settlement of the region around Canberra by Aboriginal people goes back at least 21,000 years. From the 1820s, European settlers started establishing farmland there. The foundation of the city itself was only in 1913. After the federation of the colonies of Australia the state needed a capital. Following disputes between Melbourne and Sydney, it was decided to build a new capital 150 km from the east coast. Canberra is now Australia’s biggest inland city and eighth biggest city.
The location was found in the flat areas along the Molonglo river which divides Canberra in two parts. Canberra is a planned city, showing a series of geometric forms which can clearly be seen in the map of 1940. Both north and south of the river, the streets were laid out in a spoke and wheel pattern. The centres of the wheels were located on City Hill and Capital Hill. Both were connected by Commonwealth Avenue, the major thoroughfare and connection over the river. The outline of Canberra created a contrast to the planned cities of the United States which were mostly set up in checkerboard patterns.
Results of structural change
The growth of Canberra has brought about changes to the urban structure. A new government district was created in Russell. An extensive financial and a cultural district were developed northwest and north of Capital Hill. Parts of the former railway station were integrated into the adjacent business district. In general, the developments show the growing importance of the tertiary sector. With about 30% of the workforce employed by the government of Australia and another 10% each working in the fields of health, tourism and education, Canberra’s job market is strongly marked by highly qualified services.
The growth of Canberra has brought about visible changes to the natural environment. From 1960-1964, a dam was built at the Molonglo river in the west of Canberra, creating Lake Burley Griffin. The lake adds a lot to the beauty and tourism potential of Canberra. Also, since 1940, most of Canberra’s temperate forests have been converted to parks and residential areas. In 2020, built-up land makes up about 80% of the area shown in the map.


